Garitta: The Bakery Dashboard for Streamlined Management
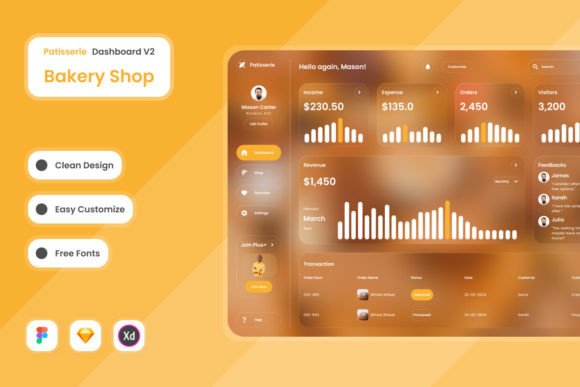
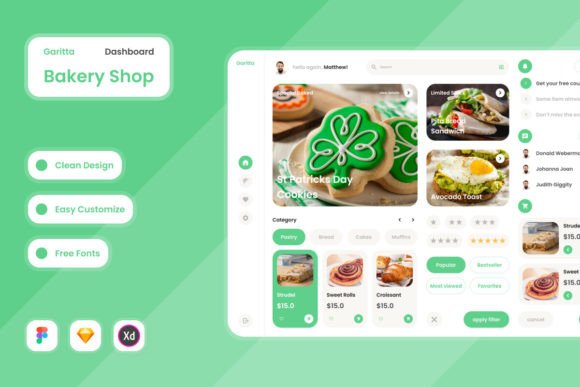
Running a successful bakery is a constant balancing act. Between managing inventory, tracking sales, and ensuring every croissant is perfectly baked, the administrative side can quickly become overwhelming. This is where Garitta - Bakery Shop Dashboard V1 enters the picture, not as another piece of complicated software, but as a thoughtfully designed control center. It’s a modern dashboard template that transforms raw data into a clear, actionable visual narrative for your business. Think of it as the central nervous system for your bakery, where every metric, from daily revenue to best-selling items, is presented with intuitive clarity.
A Visual Style Built for Clarity and Speed
The first thing you notice about Garitta is its clean, contemporary aesthetic. The design avoids clutter, using ample white space and a well-considered color palette to guide your eye to what matters most. This isn't just about looking good; it's a practical application of modern typography and visual hierarchy. Key figures and charts stand out, while secondary information recedes gracefully. The personality of the Garitta dashboard is professional yet approachable, mirroring the best qualities of a neighborhood bakery itself. It’s a visual system that feels organized and reliable, which directly translates to reduced cognitive load when you're checking on business performance. The layers are meticulously organized, a detail designers will appreciate when making adjustments in Figma, Sketch, or Adobe XD. This level of structure in the design assets ensures that customizing the dashboard to match your brand identity is a straightforward process, not a frustrating puzzle.
From a design perspective, Garitta leverages a smart combination of sans serif and serif font pairings. The primary interface uses a clean, highly legible sans serif typeface for data points and navigation, ensuring quick readability on both desktop and mobile versions. This is complemented by a more characterful serif or display font used sparingly for headings and branding elements, adding a touch of warmth and sophistication. This strategic use of font pairing creates a clear visual hierarchy, making the dashboard scannable in seconds. The inclusion of global text and color styles is a game-changer for consistency, allowing you to update the entire dashboard's look with a few clicks—a fundamental principle for maintaining a strong brand identity across all touchpoints.
Practical Applications Beyond the Bakery Counter
While the name suggests a specific use case, the framework and design principles of Garitta are remarkably versatile. The dashboard's structure is a masterclass in information design, making it an excellent reference for any project involving data presentation. Imagine using its layout as inspiration for a marketing report for a client, a sales performance tracker for a small e-commerce store, or even a personal finance overview. The design's strength lies in its adaptability. The clean lines and modular components could easily be repurposed for a SaaS product dashboard, a fitness app progress tracker, or a content creator's analytics hub. The open-source fonts and free vector icons included in the package further enhance this flexibility, providing a ready-made toolkit that avoids licensing headaches for various projects.
For entrepreneurs and small business owners, studying Garitta offers practical lessons in user experience. How it prioritizes key performance indicators, its use of visual cues to indicate trends, and its mobile-responsive design are all observable best practices. A designer could use this template as a starting point, adapting its components for a client's unique needs, thereby speeding up the workflow while ensuring a professional result. The compatibility with major design platforms means the source files are not locked into a single ecosystem, promoting a smoother collaborative process between designers, developers, and stakeholders.
Integrating Garitta into Your Creative Workflow
When considering a design asset like Garitta, the evaluation process should be practical. First, assess its visual compatibility with your project's personality. Does the style feel aligned with your brand's voice? For a rustic, artisanal brand, the modern dashboard might need significant customization. For a contemporary cafe or a tech-forward food startup, it could be a near-perfect fit. Next, dive into the technical details. The organized layers and pre-set styles are huge time-savers, but you should still test the font pairings with your own content. Does the chosen typeface remain readable when displaying your specific data sets? Does the color scheme hold up with your brand's primary and secondary colors?
Remember that this is a template for a dashboard, not a comprehensive commercial font family. Its typographic choices are optimized for UI and data visualization. Using the same display font from the dashboard for a large-scale print poster or extensive body text in an editorial design might not yield the best results, as each typeface has its ideal context. The true value of Garitta lies in its role as a holistic design system. It provides a cohesive set of elements—typography, icons, layout, and color—that work together harmoniously. By studying this system, you can glean insights into creating visual consistency for your own brand identity, whether you're designing social media graphics, packaging, or a website.
Ultimately, Garitta - Bakery Shop Dashboard V1 is more than a set of pretty charts. It's a practical tool and a learning resource. It demonstrates how thoughtful design can simplify complex information, a skill valuable to any designer, marketer, or business owner. Its real-world value is in providing a clean, organized, and customizable foundation that can save hours of work and elevate the professionalism of any data-driven project. Whether you implement it directly for a bakery client or use its design language to inspire your next web design or app interface, Garitta offers a tangible pathway to more efficient and visually coherent digital management.